I am currently exploring the 630m band primarily by monitoring WSPR broadcasts, in order to get a sense of what propagation is like, and what my receive capabilities are.
I have two openHPSDR Hermes transceivers at Hilltop, each one hooked up to an inverted L antenna fed with hookup wire which is connected to its own AMRAD Active Antenna LNA.
One of antennas has its axis (looking away from the feedpoint) at 35 degrees azimuth, and the other has its axis looking at 125 degrees. The 35-degree-axis antenna is slightly less than 50 feet long. The other is about 40 feet long. The axes for both are shown in the Google Maps satellite views below:


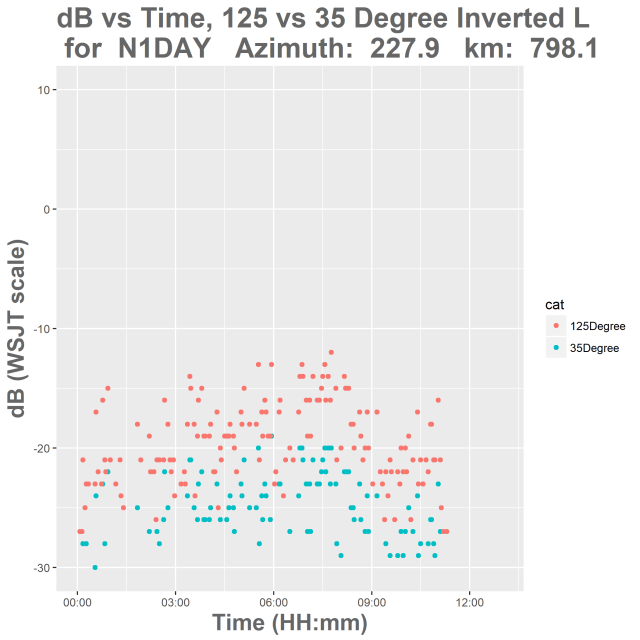
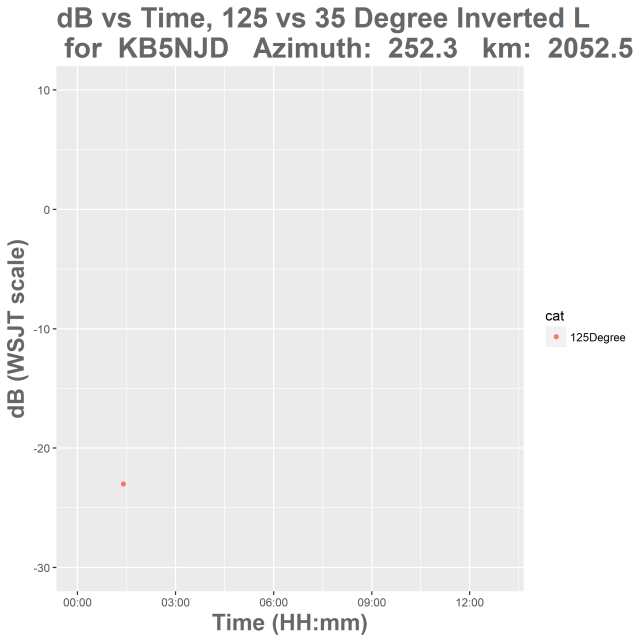
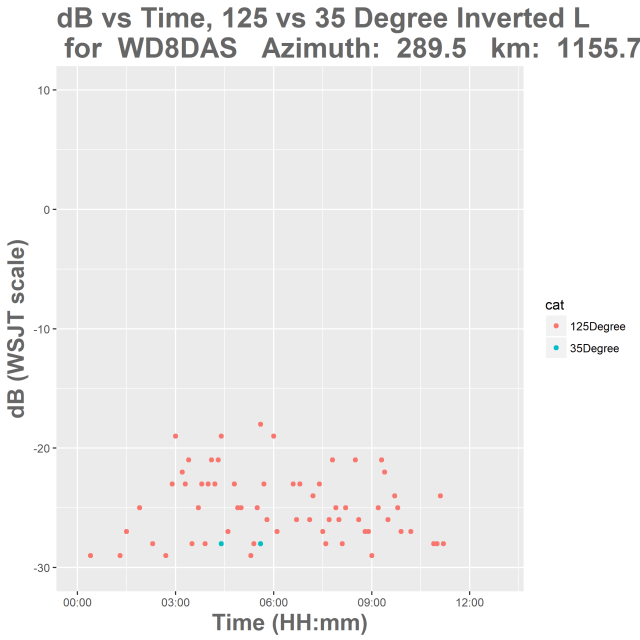
Although the 35-degree-axis antenna is higher, at 15 feet vs 8 feet for the 125-degree-axis antenna, the 125-degree-axis antenna performs much better. Perhaps this is because the 35-degree-axis antenna is adversely affected by the towers at each end of its course.
You can see this on the graphs below, one for each callsign detected last night, showing the signal strength in WSJT dB units vs time as HH:mm. The 125-degree-axis antenna is pink in each graph, and the 35-degree-axis antenna is blue. There are 5 stations for which ONLY the 125-degree-axis antenna garnered any decodes.
Many stations don’t leave their equipment on during the day, and some of the individual station “start” and “stop” times may reflect this, rather than propagation. Also, for the same reason, one can’t assess night vs day from these graphs, even though I continued to record data throughout the day. Here are the graphs, in ascending azimuth order:


Here is a plot of average signal levels over time starting at 0000 UTC and continuing until there were no more stations heard. The signal strengths do appear to drop off around sunrise:

That’s all for today!
73,
Roger
W3SZ